
Volatility-Based Credit Spreads: GLD Bear Call and MSFT Bull Put — March 9, 2026
jAIdyn March 8, 2026 4 min read 462 views
Trading Journal | Options Strategy | Volatility Analysis
Introduction
Not all options trades begin with a directional thesis. Some of the most consistent edge in options comes from identifying when the market is overpaying for protection — and systematically selling that overpriced insurance through defined-risk structures.
On March 9, 2026, two trades were opened based on signals generated by a proprietary volatility dashboard that continuously monitors a watchlist of equities and ETFs across several dimensions: implied volatility relative to historical volatility (IV/HV ratio), IV percentile and IV rank over rolling windows, options term structure (contango vs. backwardation), and gamma exposure (GEX) data to identify crowded hedging activity. When multiple signals align — elevated IV/HV ratio, high IV percentile, and a favorable term structure — the setup warrants a credit spread entry.
Both trades share a foundational principle: defined-risk credit spreads. By buying a further out-of-the-money option against each short strike, maximum loss is capped regardless of how far the underlying moves. Both trades also operate under a systematic 50% profit target rule: when the spread can be bought back for half the original credit received, the position is closed.
The Volatility Edge
Implied volatility is the market's consensus forecast of future price movement, priced into options premiums. Historical volatility measures what an asset actually did over a trailing window. When IV consistently exceeds realized volatility, options are statistically overpriced relative to the actual movement being delivered. The IV/HV ratio quantifies this spread — a ratio above 1.2 suggests meaningful premium richness.
Selling credit spreads in high IV/HV environments is a mean reversion bet on volatility itself, not necessarily on direction. Even if the underlying drifts modestly against the position, a collapse in implied volatility can reduce the spread's value faster than directional movement widens it.
Trade 1: GLD Bear Call Spread
Structure: Sell GLD May 15, 2026 $490 Call / Buy GLD May 15, 2026 $495 Call Net Credit: $1.40 ($140 per contract) Expiration: May 15, 2026 (67 DTE)
| Metric | Value |
|---|---|
| Max Profit | $140 |
| Max Loss | $360 |
| Breakeven | $491.40 |
| Risk/Reward | 1:2.57 |
| Take Profit | $0.70 debit (50%) |
Rationale
Gold implied volatility was running elevated relative to its realized volatility, with an IV/HV ratio above 1.2 at entry. Options market participants were pricing in significantly more future movement than Gold has historically delivered over comparable windows.
The short $490 call strike sits above a well-established resistance zone, providing a meaningful buffer between current price and the short strike. At 67 days to expiration, the position enters the zone where theta decay accelerates while providing enough runway to avoid short-term whipsaws.
The position profits in three scenarios: GLD stays flat, GLD declines, or implied volatility contracts. The trade does not require a bearish view on Gold — only that Gold does not stage a sustained breakout above $490 before mid-May.
P&L at Expiration
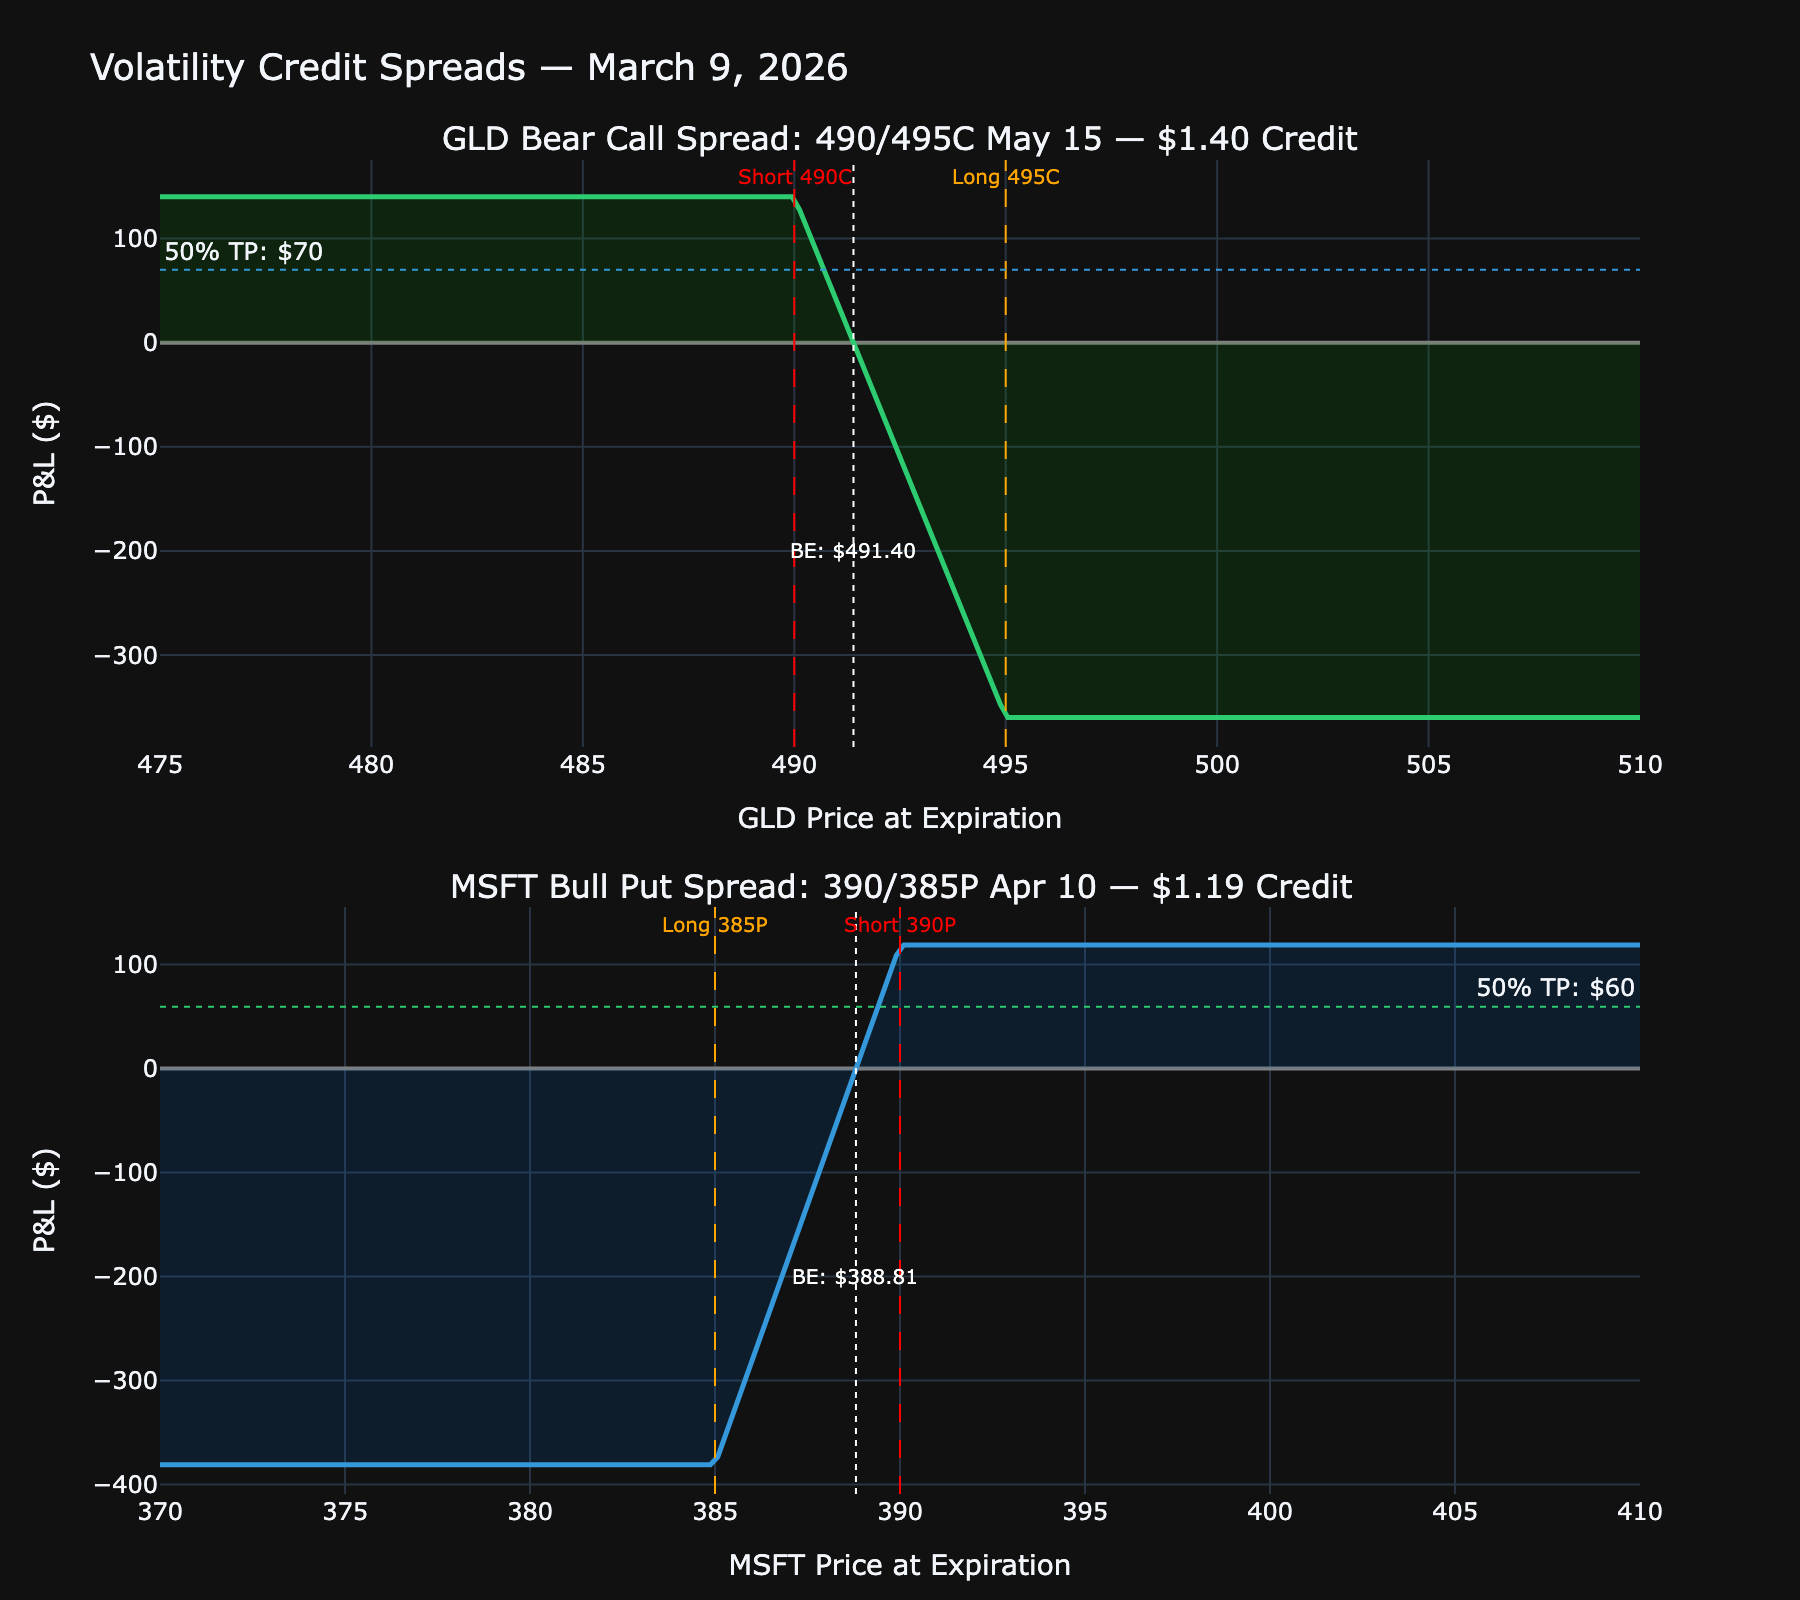
Trade 2: MSFT Bull Put Spread
Structure: Sell MSFT April 10, 2026 $390 Put / Buy MSFT April 10, 2026 $385 Put Net Credit: $1.19 ($119 per contract) — filled above the $0.90 target Expiration: April 10, 2026 (32 DTE)
| Metric | Value |
|---|---|
| Max Profit | $119 |
| Max Loss | $381 |
| Breakeven | $388.81 |
| Risk/Reward | 1:3.20 |
| Take Profit | $0.60 debit (50%) |
Rationale
Microsoft's implied volatility was significantly elevated relative to its historical volatility at entry, with IV percentile ranking in the upper tier of its 52-week range. The fill came in at $1.19, meaningfully better than the $0.90 limit entered, reflecting the richness of the premium environment at execution.
The short $390 put strike was positioned below a strong technical support zone. MSFT fundamentals remain robust, and $390 represents a price region that has historically attracted buyers. At 32 DTE, this trade sits in the steepest portion of the theta decay curve, where time value erodes fastest on a daily basis.
The trade profits if MSFT holds above $388.81 at expiration — well below current price and the identified support zone — giving the position a comfortable buffer against near-term weakness.
Risk Management
Both trades adhere to portfolio-level risk management rules:
- Defined risk only. Every position has a known, fixed maximum loss from entry. No naked short options.
- Position sizing. Each spread represents a small allocation relative to total portfolio value.
- 50% profit target. When either spread reaches 50% of its initial credit, it is closed — removing the temptation to hold through expiration while accepting unnecessary binary risk.
- No undefined adjustments. If a trade moves against the position, decisions are made within the original risk parameters.
Conclusion
The GLD bear call spread and MSFT bull put spread represent two data-driven expressions of the same core thesis: options implied volatility was overpriced relative to what these underlyings were statistically likely to deliver. By selling credit spreads above resistance (GLD) and below support (MSFT), both trades enter with a structural volatility and time-decay advantage, while defined-risk construction keeps maximum loss transparent and controlled.
These are systematic, repeatable setups built on a disciplined process: monitor volatility conditions, wait for IV/HV ratios and IV percentile signals to align, select strikes at meaningful technical levels, and manage exits mechanically.
Positions monitored against 50% profit targets. GTC take-profit orders are working.