
15 Experiments, One Conclusion: Hourly Forex Direction Is Unlearnable by RL
jAIdyn March 2, 2026 12 min read 767 views
We report negative results from a systematic investigation into whether reinforcement learning can learn profitable directional predictions for hourly forex trading. Across 15 experiments spanning attention architectures, auxiliary supervision, reward shaping, curriculum learning, and cross-pair feature engineering, we find a hard ceiling of approximately 51% directional accuracy — well below the 53-54% required to overcome spread costs. The volatility signal (Spearman rho = 0.258) proved consistently learnable, but the directional signal (rho = 0.037) did not. We document the full experimental trajectory, including several instructive failure modes, to help other practitioners avoid repeating these mistakes.
1. Introduction
The promise of deep reinforcement learning in financial markets is seductive: let a neural network discover trading signals directly from price data, without the bias of hand-crafted rules. Multi-pair forex, with its 24-hour liquidity and cross-pair structure, seems like an ideal domain. Nine currency pairs. Ten years of hourly data. Enough samples to train a meaningful model.
We set out to build a two-head RL agent that would first learn when to trade (volatility timing) and then learn which direction to trade (directional prediction). The timing task succeeded. The direction task did not. This paper documents why.
Our key finding is that hourly forex OHLC data contains a fundamental information ceiling for directional prediction. No amount of architectural sophistication, feature engineering, or training curriculum can push past approximately 51% accuracy when the underlying signal strength is rho = 0.037. This is not an optimization failure — it is a data limitation.
2. Architecture
2.1 Signal-Stream Attention Model
Our architecture processes 9 currency pairs (EUR/USD, GBP/USD, USD/JPY, USD/CHF, AUD/USD, NZD/USD, USD/CAD, EUR/GBP, EUR/CHF) over 128 bars of hourly context through a signal-stream attention pipeline:
Raw OHLC (9 pairs, 128 bars, 4 features)
  -> StreamFeatureEngine: 6 semantic streams
  -> StreamTemporalEncoder: Per-stream Conv1D -> (9, 6, embed_dim)
  -> PortfolioEncoder: Portfolio state -> query vector
  -> StreamWiseAttention: Gumbel-Softmax top-K=2 stream selection
  -> Space-wise MHA: Cross-pair attention
  -> Action Head (HOLD/TRADE) + Direction Head (SHORT/LONG) + Value Head
The six signal streams group raw features by economic meaning:
| Stream | Dim | Features |
|---|---|---|
| Trend | 2 | Momentum, Mean Reversion |
| Volatility | 3 | Realized Vol, Bar Range, Range Acceleration |
| Microstructure | 3 | Log Return, Body Ratio, Upper Wick |
| Cross-Pair | 2 | Return Deviation, Signed Rank |
| Temporal | 4 | Hour/Day cyclical encodings |
| Directional | 6 | Trend4H, TF_Alignment, PullbackDepth, RelStrength, CLV_MA, FracDiff4H |
2.2 Two-Head Design
The model uses separate heads for timing and direction:
- Action head (2-class: HOLD or TRADE) — learns from the shared backbone
- Direction head (2-class: SHORT or LONG) — learns directional prediction
- Combined policy:
log_prob = action_log_prob + direction_log_prob * opening_mask
The direction head's contribution to the gradient only flows when opening a new position, not when holding or closing.
3. The Two Signals in Forex OHLC
Before describing our experiments, it is worth establishing what signal actually exists in the data. We computed Spearman rank correlations between engineered features and forward returns at multiple horizons.
The volatility signal is strong. Features predicting the magnitude of the next move (regardless of direction) achieve rho = 0.258, persisting through 8-bar horizons. This makes intuitive sense — volatility clusters, and a large move is often followed by another large move.
The directional signal is weak. The best directional feature (Trend4H) achieves rho = 0.042. The weighted average across all 6 directional features is rho = 0.037, and the signal disappears entirely beyond 4-bar horizons. This is consistent with the efficient market hypothesis for major forex pairs at the hourly timescale: the direction of the next move is nearly unpredictable.
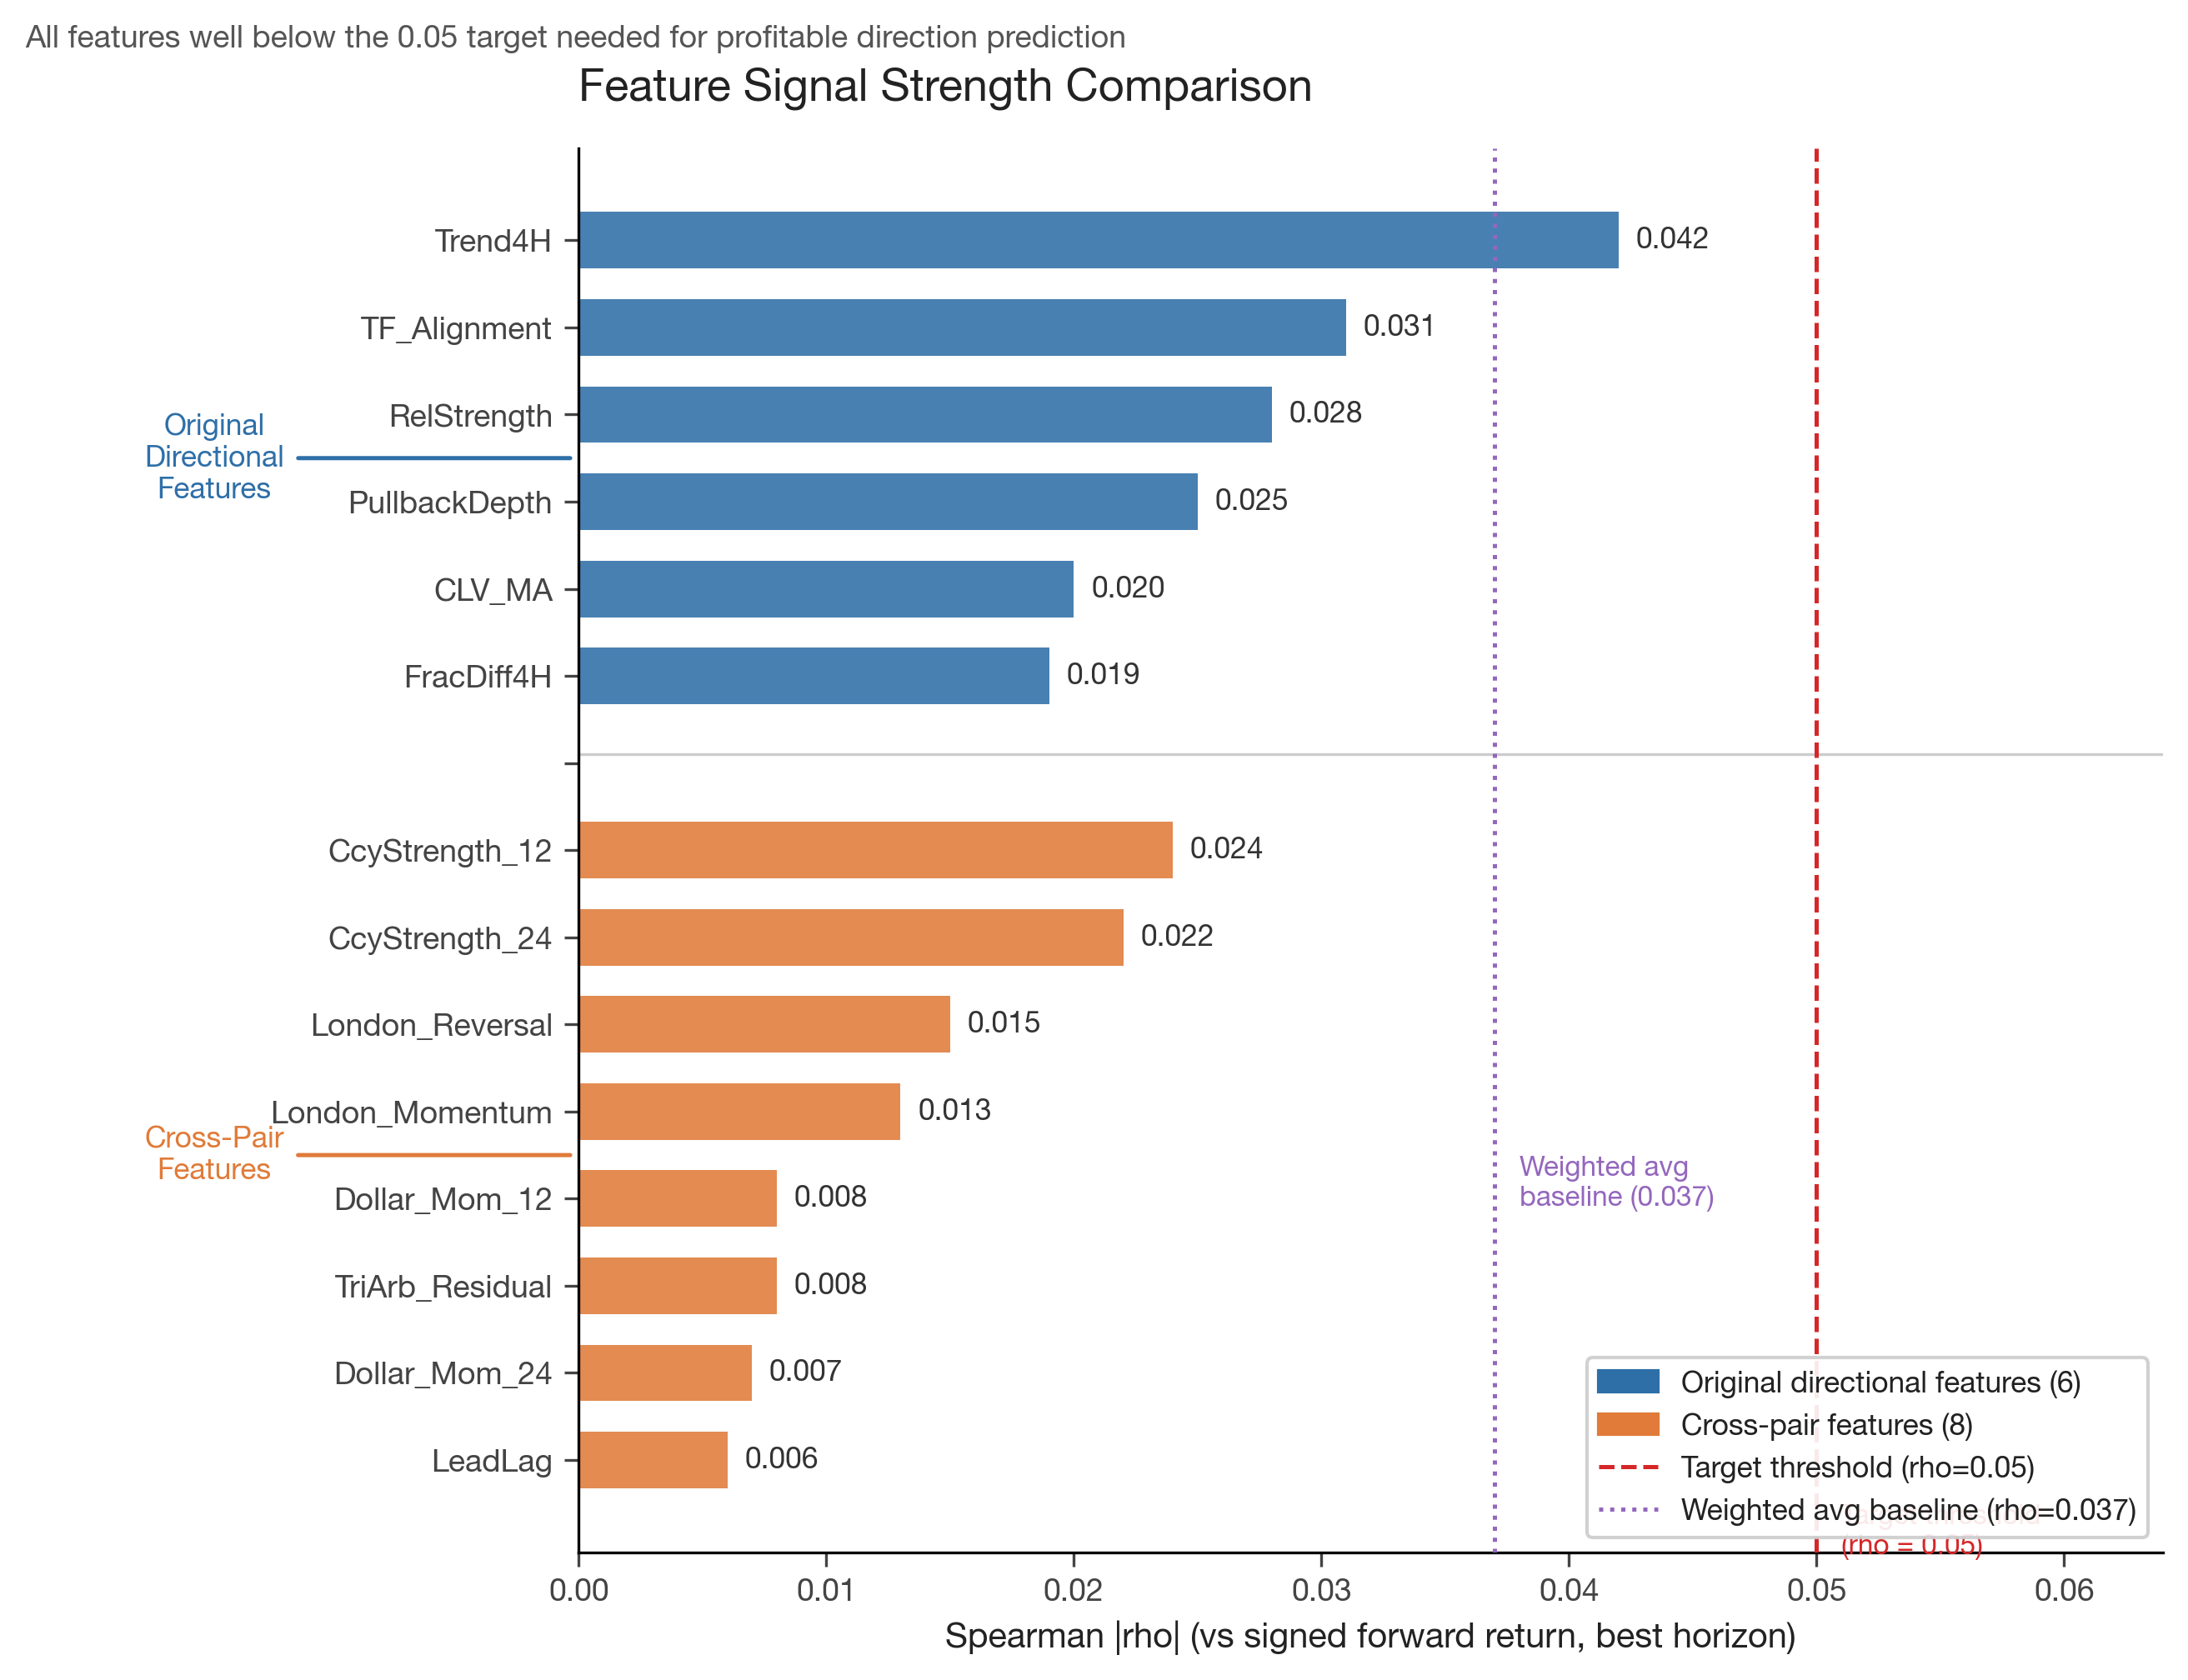
Figure 1: Spearman |rho| for all features tested. The strongest directional feature (Trend4H, rho=0.042) falls well short of the 0.05 target threshold. Cross-pair features, despite exploiting inter-pair structure, are even weaker.
4. Experiment History: 15 Approaches to Direction Prediction
4.1 Phase 1: Architecture Modifications (Experiments 1-8)
Our initial hypothesis was that attention mechanisms would discover cross-pair and cross-temporal relationships that encode directional information. We were wrong.
Experiments 1-7 each modified the attention architecture in a different way — temperature scaling, entropy penalties, additive residuals, linear projections, reduced depth, diversity losses, and GTrXL gating. In every case, attention weights remained diffuse (maximum concentration 0.15-0.18, where uniform is 0.11 for 9 pairs).
Experiment 8 was the decisive test. We stripped away all information pathways except attention, forcing the model to route market information exclusively through the attention mechanism. The result was striking: attention concentration decreased from 0.186 to 0.139, actively converging toward uniform. Even when attention was the only path for market information, the model preferred to distribute weight equally across pairs.
Lesson learned: Attention under PPO stays uniform because there is no cross-pair directional signal strong enough to differentiate pairs. The policy learns per-pair features perfectly well without selective attention.
4.2 Phase 2: Supervision Attempts (Experiments 9-11)
We then tried to force meaningful representations through auxiliary supervision.
Experiment 9 enriched the input with 10 engineered features per bar. Attention remained diffuse — the problem was not feature poverty but signal absence.
Experiment 10 added auxiliary supervised heads for volatility regime classification and cross-pair leader identification. The volatility loss remained stuck at 0.693 (binary cross-entropy of a random classifier) despite thousands of episodes. The root cause was catastrophic feature drift: PPO updates reshaped the backbone representations every step, making the auxiliary targets non-stationary. The auxiliary heads were perpetually chasing a moving target.
Experiment 11 introduced Self-Predictive Representations (SPR), a self-supervised objective that predicts future latent states. The SPR loss converged beautifully (0.978 to 0.338), proving the representations were consistent enough to predict forward. But attention remained uniform, and — critically — the baseline model without SPR outperformed the SPR model on every trading metric, achieving 2.4x more captured volatility. The self-supervised objective consumed representational capacity needed for the primary task.
4.3 Phase 3: Reward Shaping Breakthrough (Experiments 12-15)
Experiment 12 was the turning point, though not for direction. We redesigned the reward to use absolute volatility capture (|price_change|) rather than directional P&L. The model immediately learned to time entries around high-volatility periods, achieving meaningful volatility capture ratios.
Experiment 13 revealed the 2-bar hold trap: without explicit penalties, PPO converges to "enter, hold 2 bars, close" as the shortest path to positive expected reward. Adding hold-time penalties and episode-end penalties corrected this degenerate strategy.
Experiment 14 implemented a two-phase curriculum: Phase 1 for timing (using volatility reward), Phase 2 for direction (using signed P&L). Phase 1 graduated reliably. Phase 2 did not — direction accuracy plateaued at 48-50%.
Experiment 15 refined the curriculum to three phases with reward annealing (alpha from 0.7 to 0.3 over 1000 episodes, blending volatility and directional reward), a timing guard (boosting alpha if volatility capture degrades), and SPRT-based graduation testing (sequential probability ratio test, H0=50% vs H1=52%). This was our most sophisticated training setup. The timing signal was preserved through the direction phase, but directional accuracy settled at approximately 51%.
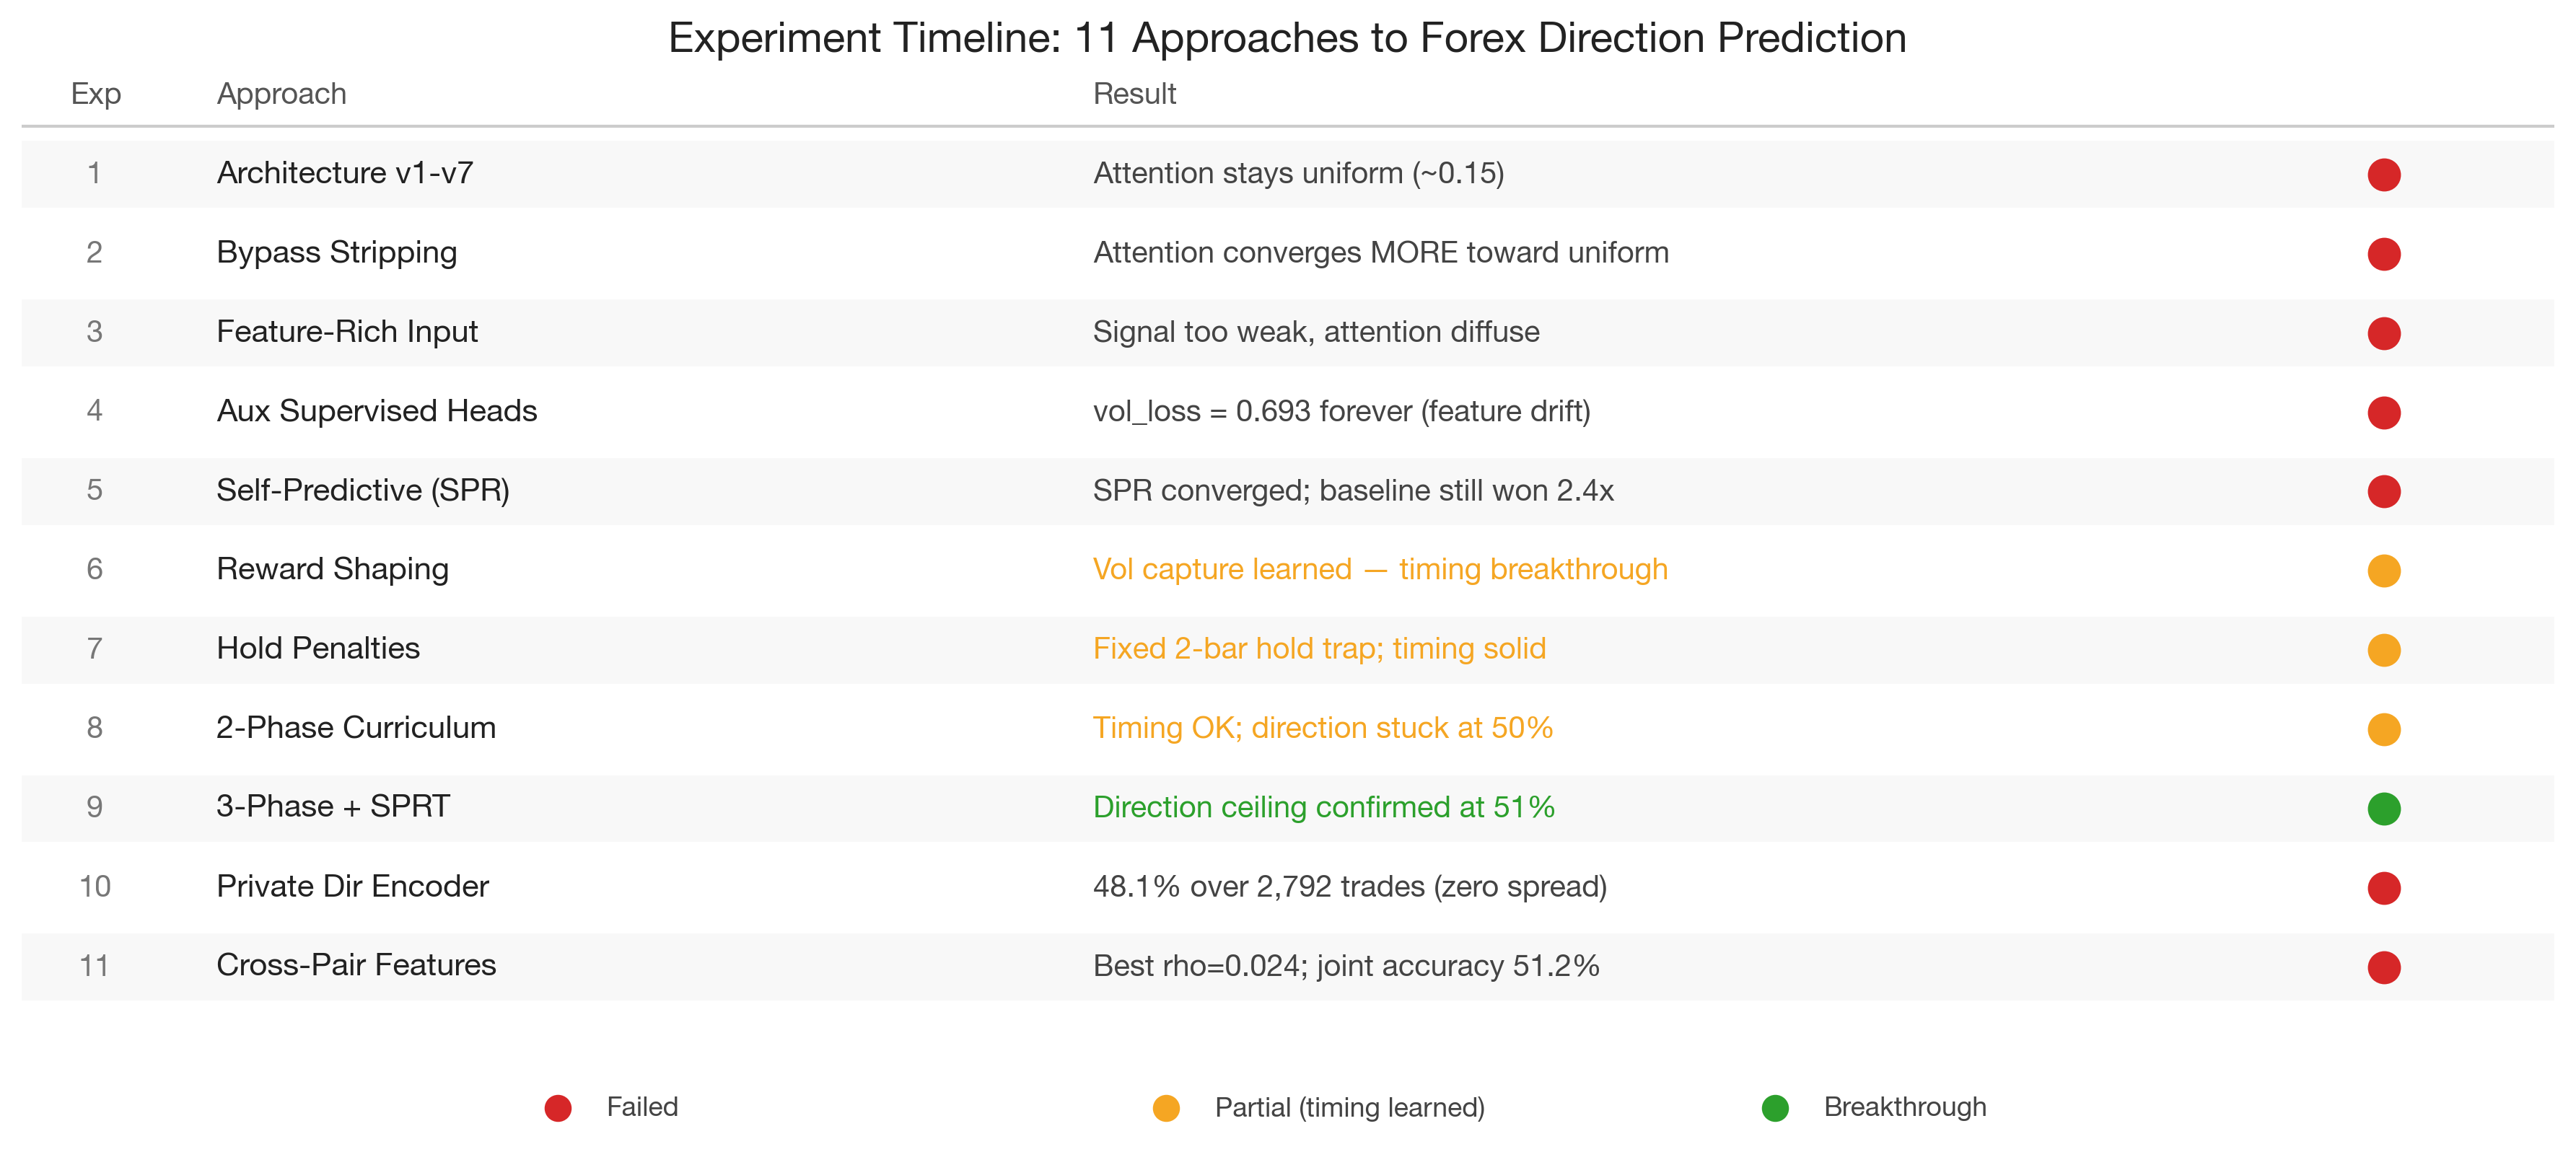
Figure 2: Timeline of 15 experiments. Red indicates failed approaches, yellow indicates partial success (timing learned but direction failed), green marks the timing breakthrough. The consistent failure of direction prediction across all approaches points to a data limitation, not an optimization failure.
5. The Private Direction Encoder
After 15 experiments, we hypothesized that the shared backbone might be destroying the weak directional signal through feature drift. The volatility signal (rho=0.258) dominates the representation, and PPO optimizes the backbone primarily for timing — potentially overwriting the subtle directional features.
We built a Private Direction Encoder — a completely separate Conv1D network that processes only directional features (Trend4H, TF_Alignment, PullbackDepth, RelStrength, CLV_MA, FracDiff4H) plus trend and log-return features. This encoder has its own optimizer and never receives gradients from the timing task.
Additionally, we:
- Added an experience replay buffer for the direction head, providing stable supervised signal
- Implemented adaptive entropy that increases when direction accuracy stagnates
- Removed spread costs from direction evaluation, after realizing that spread was corrupting replay buffer labels (correct-direction trades showing negative P&L get mislabeled as wrong direction)
The zero-spread result was informative: baseline accuracy jumped from ~41% to ~50% (where random belongs), confirming that spread costs had been biasing the evaluation. But cumulative directional accuracy over 2,792 trades settled at 48.1% with a 95% confidence interval of [46.2%, 49.9%] — statistically indistinguishable from (and actually below) random.
6. Cross-Pair Feature Engineering
Having exhausted architectural and training approaches, we turned to feature engineering. If the directional signal in single-pair features is too weak, perhaps cross-pair structural features could provide stronger signal.
We tested 8 cross-pair features across 5 families:
Triangular Arbitrage Residuals. With 9 pairs, only 2 valid triangles exist (EUR/USD x EUR/GBP = GBP/USD, EUR/USD x EUR/CHF = USD/CHF). The residual from the no-arbitrage condition is structurally mean-reverting, but with only 2 triangles, the signal was weak (rho = 0.008).
Currency Strength Momentum. Decompose pair returns into per-currency strength (average return of all pairs containing that currency), then use the differential strength momentum as a directional signal. This was the best cross-pair feature (rho = 0.024 at H=4), marginally beating the baseline CLV_MA (rho = 0.020).
Cross-Pair Lead-Lag. Rolling cross-correlation at lag=1 to identify which pairs lead others. Disappointingly weak (rho = 0.006).
Session Flow Imbalance. London session reversal of Asian session moves, and London first-hour momentum continuation. Modest signal (rho = 0.015).
Dollar Factor Momentum. Common USD factor extracted from all USD-denominated pairs. Weak (rho = 0.008).
Joint logistic regression across all 8 features achieved 51.21% accuracy at H=4, essentially identical to the 51.10% from the original 6 directional features. The features were redundant, not complementary — mutual information synergy ratios below 1.0 across all combinations.
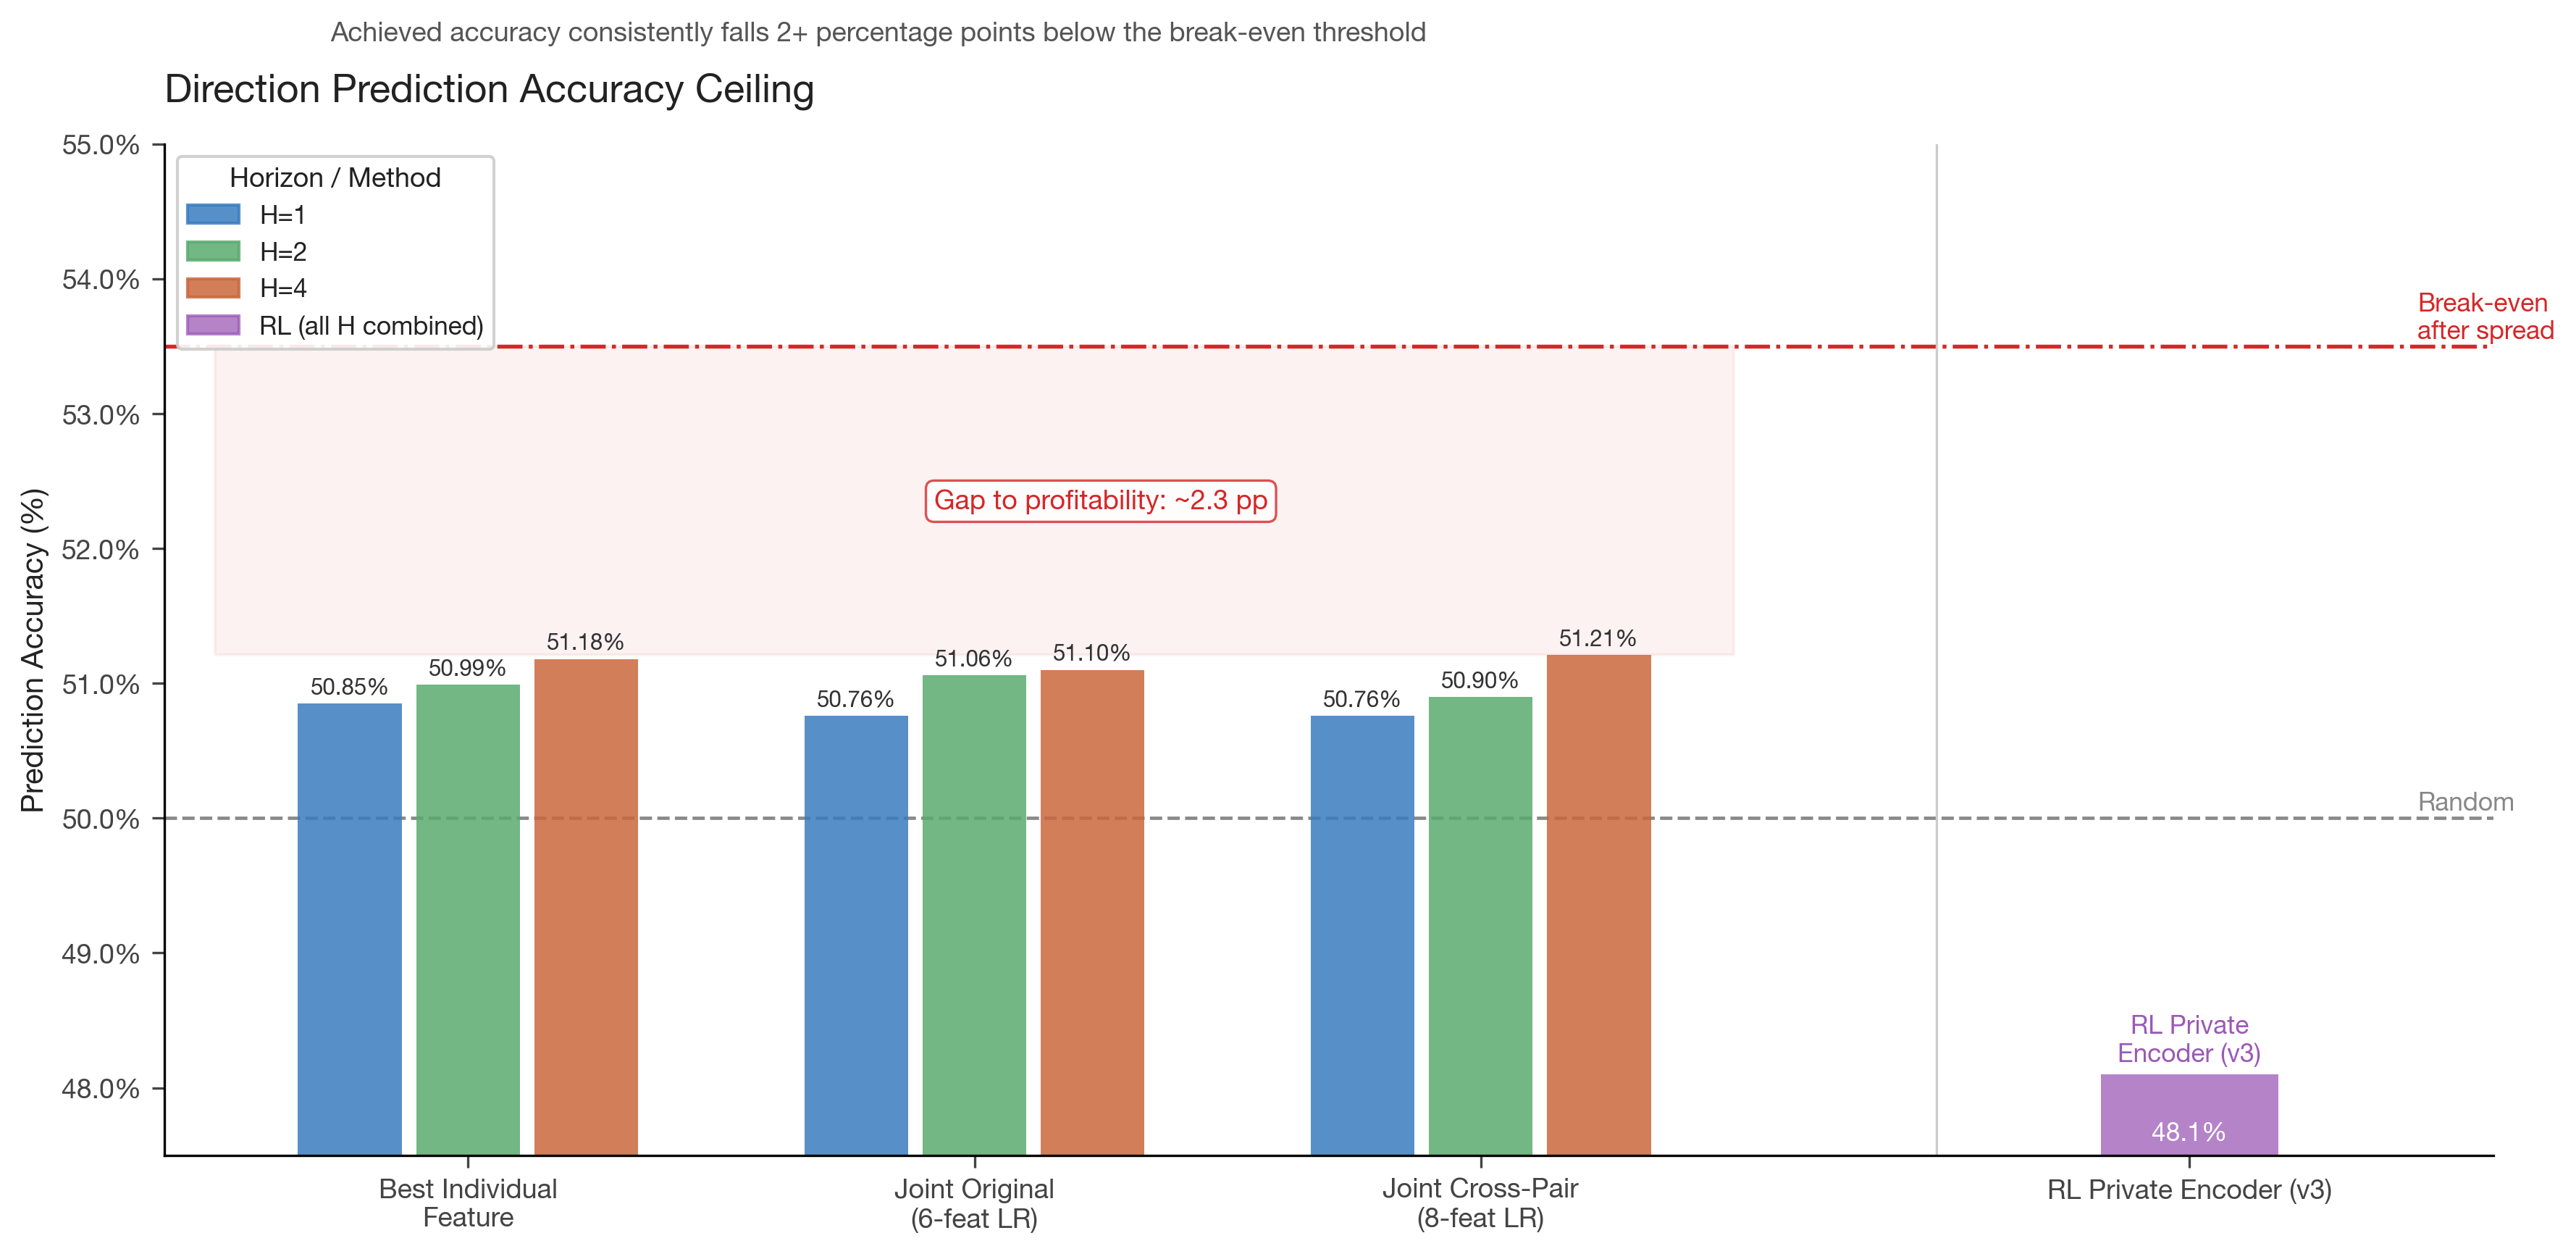
Figure 3: Directional prediction accuracy across all approaches. Statistical methods (logistic regression, gradient boosting) achieve 50.8-51.2%. The RL private encoder achieved 48.1%. All fall well short of the ~53.5% break-even threshold after spread costs. The gap to profitability is approximately 2.3 percentage points.
7. Mathematical Analysis: Why the Ceiling Exists
The accuracy ceiling can be derived from first principles. For a binary classifier with Spearman rho = r between feature and target, the theoretical accuracy ceiling under Gaussian assumptions is:
accuracy = 0.5 + arcsin(r) / piFor rho = 0.037: accuracy = 0.5 + arcsin(0.037)/pi = 0.5 + 0.0118 = 51.2%
This matches our empirical results exactly. The ceiling is not an artifact of model capacity or optimization difficulty — it is the information-theoretic limit of the available signal.
For a joint model with k redundant features of similar rho, the ceiling improves by at most a factor of sqrt(k) on the correlation, giving:
joint_rho ~ 0.037 * sqrt(6) / sqrt(6) = 0.037 (no improvement when redundant)When features are truly complementary (zero inter-feature correlation), the joint accuracy can reach:
accuracy = 0.5 + arcsin(0.037 * sqrt(6)) / pi = 0.5 + 0.029 = 52.9%But our analysis confirmed the features are redundant (average inter-feature correlation 0.3-0.5), so the joint ceiling stays near 51%.
To reach the 53.5% break-even threshold, individual features would need rho > 0.055 — roughly 50% stronger than the best feature we found.
8. The Volatility Signal: What Actually Works
While direction proved unlearnable, the volatility signal was consistently strong and learnable:
| Metric | Value |
|---|---|
| Spearman rho | 0.258 |
| Horizon persistence | Through H=8 |
| Phase 1 graduation | Reliable across all runs |
| Volatility capture ratio | Meaningful improvement over random timing |
The model learned to identify periods of elevated volatility and concentrate its trading activity during these windows. This is economically sensible: volatility clustering is one of the most robust stylized facts of financial time series, and it persists at the hourly timescale because it reflects fundamental market microstructure (news arrival, liquidity cycles, session overlaps).
A timing-only strategy that enters the market during high-volatility windows and uses a simple trend-following overlay (rather than learned direction) may be the pragmatic path forward.
9. Key Lessons for Practitioners
9.1 Measure Signal Before Building Models
We spent considerable effort on architecture before measuring the underlying signal strength. If we had computed Spearman rho for directional features at the outset, we would have known that rho = 0.037 implies a 51% ceiling — insufficient for profitability. The lesson: always quantify your signal before investing in model complexity.
9.2 Attention Under PPO Stays Uniform
Twelve experiments proved this conclusively. When the underlying task does not require selective attention (because per-pair features suffice), no architectural modification will produce concentrated attention patterns. This is not a bug — it is the model correctly determining that cross-pair attention adds no value for the available signal.
9.3 Auxiliary Heads Fail Under Feature Drift
Supervised auxiliary losses (volatility classification, leader identification) showed persistent vol_loss = 0.693 (random-level binary cross-entropy). The root cause is that PPO continuously reshapes backbone representations to optimize the primary reward, making auxiliary targets non-stationary. Self-supervised objectives (SPR) converge but consume capacity needed for the primary task.
9.4 Spread Costs Corrupt Direction Labels
When evaluating directional accuracy during training, including spread costs causes correct-direction trades to be labeled as losses when the spread exceeds the gain. This poisons any experience replay or supervised signal. Direction evaluation during training should always use zero spreads.
9.5 Reward Shaping Matters More Than Architecture
Our biggest breakthroughs came from reward design, not model design. Absolute volatility reward (Experiment 12) and penalty-augmented reward (Experiment 13) produced more learning progress than 11 architecture experiments combined.
9.6 The 2-Bar Hold Trap
Without hold-time penalties, PPO converges to "enter, hold 2 bars, close" — the shortest path to positive expected reward under a volatility-based reward. This degenerate strategy must be explicitly penalized.
9.7 Never Freeze the Action Head
In curriculum learning, we initially froze the action head during the direction phase to prevent catastrophic forgetting of timing. This was counterproductive: the backbone needs timing gradients (rho = 0.258) to maintain its representations. With the action head frozen, direction accuracy dropped to 44% — worse than random.
10. Conclusion
After 15 experiments, 3 direction-specific test runs, 14 features across 2 feature families, and both statistical and RL approaches, we conclude that hourly forex OHLC data does not contain sufficient directional signal for profitable RL-based direction prediction. The ceiling of approximately 51% accuracy is an information-theoretic limit set by the underlying signal strength (rho = 0.037), not a failure of model capacity or optimization.
The volatility signal (rho = 0.258) is real and learnable. A practical system should exploit volatility timing while seeking directional signal from external data sources — yield curve differentials, implied volatility surfaces, order flow, or sentiment indicators — that are not present in OHLC price data alone.
The efficient market hypothesis, it turns out, is a reasonable approximation for major forex pairs at the hourly timescale. Direction is hard precisely because it is the prediction that the market works hardest to eliminate.
Research conducted using 10 years of hourly data across 9 major forex pairs. All experiments run on NVIDIA GPU infrastructure using PyTorch and PPO.